

Analyzing India's Nifty Bank Index
Analyzing India's Nifty Bank Index
#155 - A deep dive into Time & Planetary Cycles, Market Symmetry to Forecast Future Movements in the Nifty Bank Index

Introduction
Recently, a premium subscriber requested an analysis of India’s Nifty Bank Index. The Nifty Bank Index, also known as Nifty Bank, is a specialized index that comprises the most liquid and highly capitalized Indian banking stocks. It serves as a benchmark that reflects the capital market performance of Indian bank stocks for investors and market intermediaries.
The index consists of 12 highly liquid and extensively capitalized stocks from the banking industry, such as HDFC Bank Ltd., ICICI Bank Ltd., Axis Bank Ltd., Kotak Mahindra Bank Ltd., and State Bank of India. The performance of these top banking stocks determines the index's movement.
To calculate the Bank Nifty index, the free float market capitalization method is used and rebalanced semi-annually. Investors and market intermediaries can access the latest Nifty closing report daily, which provides them with the most up-to-date information on the performance of Bank stocks in Nifty.
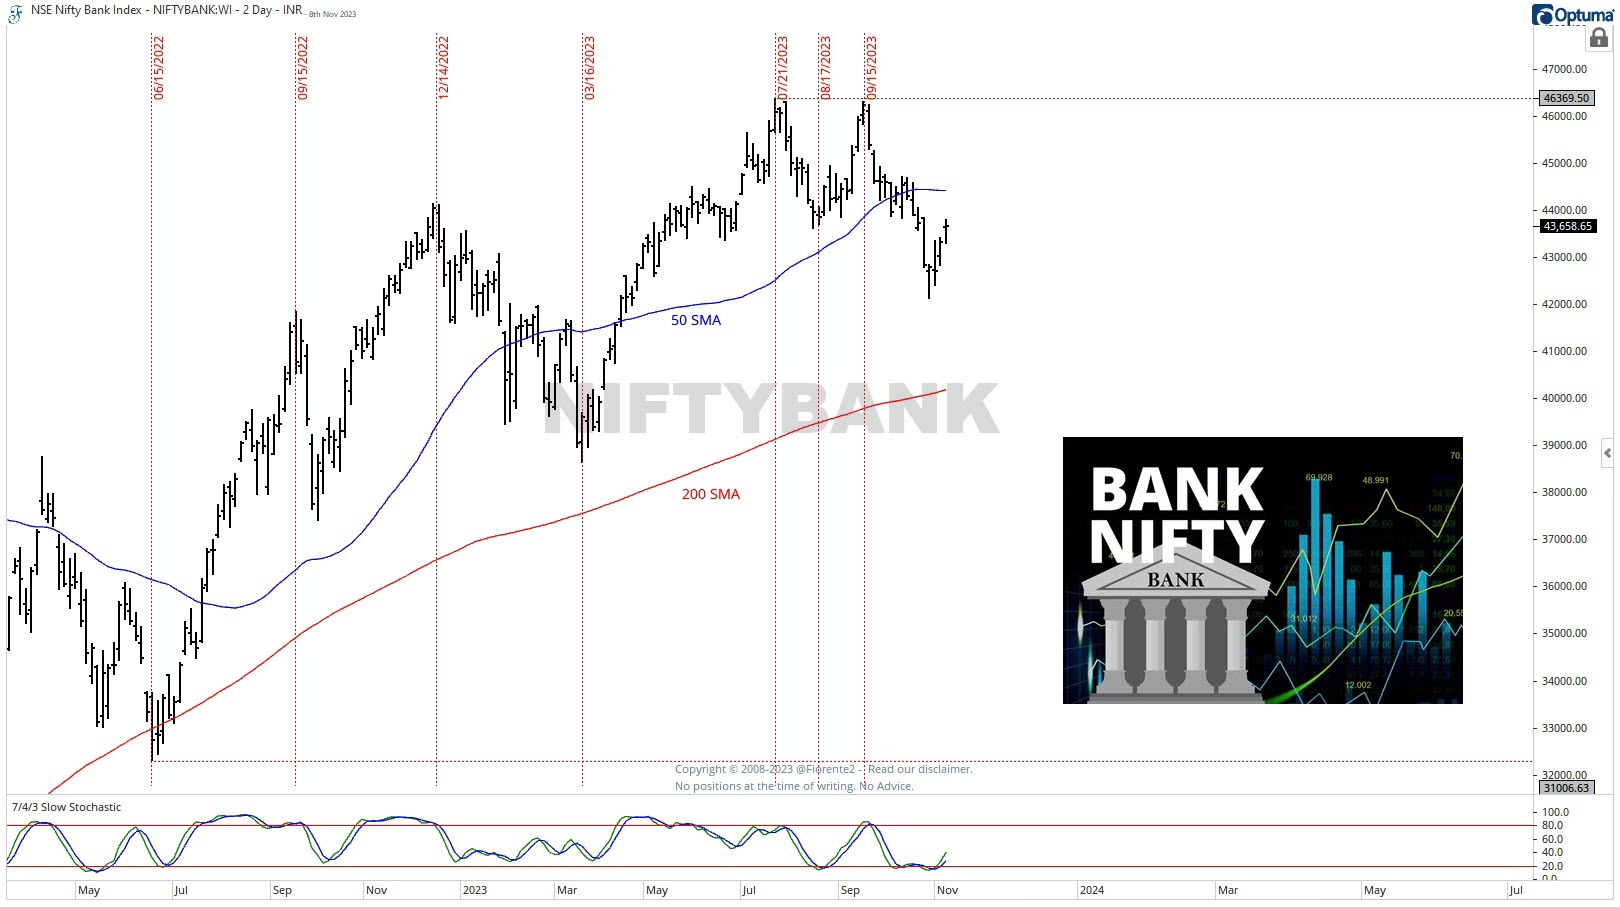
Since June 2022, the Nifty Bank index has been on an upward trend. However, in mid-August 2023, it appeared to have reversed course. Currently, the index is trading below its 50-day moving average and indicating an oversold market as the Slow Stochastic Indicator shows.
It is uncertain whether the index will go back above the 50-day moving average, or decline further towards the 200-day moving average or even below. Technical analysis can only identify overbought or oversold conditions and may not provide insight into market cycles or when a trend is likely to end.
In this post, I analyzed the Nifty Bank Index step-by-step to demonstrate additional ways to analyze and forecast its future direction. One can add another layer of analysis, such as looking for market patterns or symmetry using planetary and time cycles, to gain a better understanding of the possible underlying market movements.