

The fifth and ninth wave & the 40 month cycle
The fifth and ninth wave & the 40 month cycle
The importance of number five and nine in Elliott Wave and Gann analysis

Introduction
Last week I wrote: “From the looks of it, it looks like the $DJIA could be trading in a wave 4 of 5 of some larger degree.” We may already have started on the fifth wave of some larger degree. What we know from Elliott wave analysis is that after a fifth wave a correction will start for some time. R.N. Elliott recognised that there are nine degree of waves. However he also recognised a nine wave sequence.
Little is published on a nine wave sequence that does exists in the Elliott Wave system of analysing the market. Robert Prechter wrote about the nine wave sequence briefly in his book “Elliott Wave Principle”.
I have hardly ever seen a Elliott Wave analysis with a nine wave sequence or a package that support this. I have only seen Dan Ferrera to make such an analysis in his forecasts for which he used the filtered wave technique from Arthur Merrill. There is some merit to it as the numbers nine and five are considered important in Gann’s theory.
In todays newsletter I will analyse the $DJIA using the filtered technique of Arthur Merrill and demonstrate probable ‘Elliott’ wave nine and five wave sequences since 2009.
The commonalities in W.D. Gann and R.N. Elliott theories
From an Elliott Wave and Gann perspective the numbers five and nine do play an important role in a change of trend at the end of a five wave or nine wave sequence.
In Gann’s square of nine the numbers five and nine are important digit’s.

In W.D. Gann’s own words, taken from his commodity course:
“The number 5 is the most important number of the digits because it is the balance or main center. There are four numbers on each side of it. Note how it is shown as the balancing or center number in the Square of Nine.”
“The SQUARE OF NINE is very important because nine digits are used in reassuring everything. We cannot go beyond nine without starting to repeat and using the 0. If we divide 360° by 9, we get 40°, which measures 40, 40 months, 40 days, 40 weeks, or 40 months, and shows why bottoms and tops often come out on these angles measured by one-ninth of the circle.”
R.N. Elliott discovered that markets usually trend in a five wave sequence after which the market reverses. He also mentioned that this could be extended to a nine wave sequence, all of equal size. In his theory there are also nine degrees of waves ranging from Grand Super Cycle towards Subminuette.
So, in both theories nine and five do play an important role. In Gann’s theory number five in the middle of a square of nine stands for balance in price and time after a correction is set in, like in Elliott’s theory. Same as with a nine wave sequence a change in trend will occur in both theories. Note: also Thomas Demark famous indicator also uses a nine wave sequence.
Hence there is some remarkable commonality about W.D. Gann’s discovery and R.N. Elliot theories on the numbers five and nine. I think the law of nature must be the cause of this.
The fifth wave and the ‘40’ month cycle in the $DJIA
In above quote on the square of nine W.D. Gann’s recognised the existence of 40 month cycle as it is 1/9 of a full circle, after which a change of trend probably occurs.
The famous banker family Rothschild’s identified this cycle in 1912 as well as Kitchin in 1923 independently from each other. Also the Foundation from the study of cycles did quite some analysis and discovered a 40.68 month cycle in stock market data going back into 1789. The ‘40’ month cycle is also know as the business cycle.
Recently I made an analysis on the $DJIA cycles and in below monthly chart I annotated the most likely ‘Elliott’ Wave patterns and displayed a 44 month cycle evolving (close to the ‘40’ month cycle) as shown in below monthly chart.
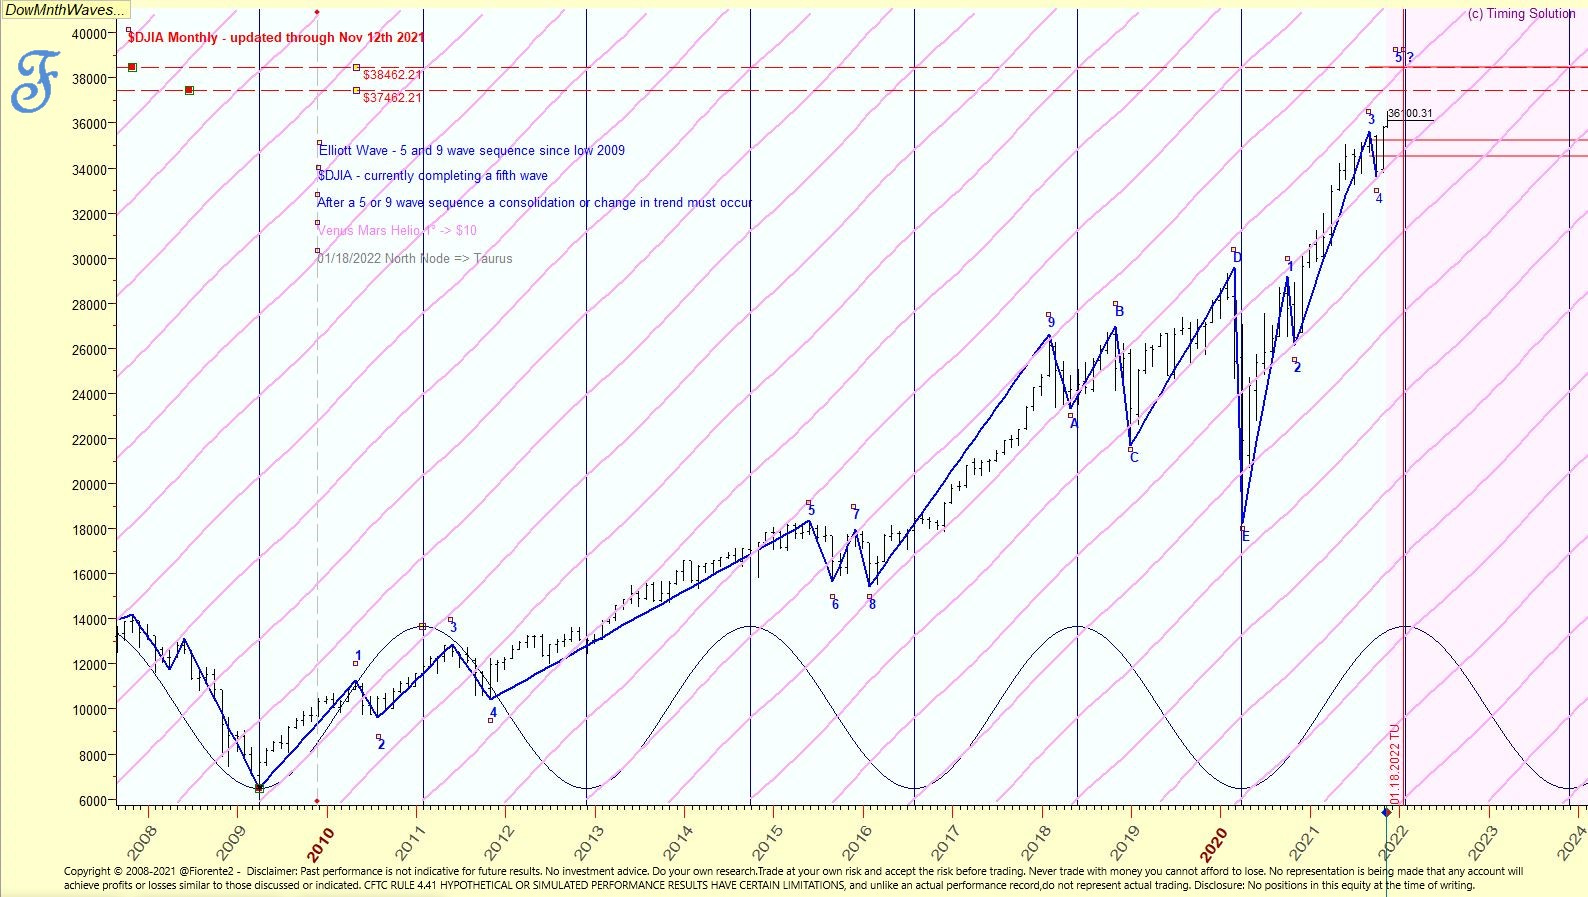
I have used Arthur Miller’s filtered wave approach to see if we can find a five and nine wave pattern in the stock market advances from March 2009 onwards. Perhaps we can not call them ‘Elliott’ Waves, as in the Elliott Wave theory the third wave is regarded as the largest.
In the first 6 years a five wave pattern into May 2015 emerged after which a relatively small three wave correction set in. In keep on counting the waves until finishing the ninth wave it is clear that a bigger correction was expected hereafter. An A-B-C-D-E, of a larger wave five corrective pattern was developing into the opposite direction from 2018 into the lows of 2020. This is compliant with Gann’s theory on the square of nine for major change in trend to occur
The lows of 2020 seem also to align with a low in probably the 40 month cycle. Since then a new cycle started which is evolving in what appears to be a five wave pattern. The analysis also suggests that in the next couple of months the $DJIA will likely find a crest. From the looks of this the ‘40’ month cycle seem to align with a Venus Mars cycle for which the planetary fan is drawn on the chart in pink as well. The fib analysis done on the filtered waves does also suggest a crest between 36000-38000.
The Venus Mars cycle
From the lows of March 2009 the Venus - Mars Geo/Helio cycles will return exactly to the same angle on the Venus Rx date in December 19th 2021 after respectively 2160°/5040°. In Helio this will be on 154° angle and this is very close to 154 months from the March low of 2009 as well. In below chart I have highlighted the Venus Mars Geo cycle aligning with probably the ‘40’ month business cycle.

Will the angle between Venus Mars Helio of 154° at the low of 2009, which was on a Venus Rx date reveal, a possible future change in trend on a Venus Rx date (December 19th 2021) when Venus Mars Helio revisits this angle again?
The Fibonacci extension analysis (123.6-161.8%) from the channel drawn from mid 2008-March 2009, in above charts suggest a probable target of 36000-38000 and even a bit beyond that range on the $DJIA is possible. Note: we have already passed the 36000.
Looking beyond 2021 I also found that on January 18th 2022 the North Node will enter into Taurus. According to Louise McWhirter’s theory the economic cycle will enter into a phase of below normal growth when this happens.
So, I would not be surprised if the $DJIA takes a little bit more time to form a crest and could even head into a January 2022 crest as well.
Conclusion
In addition to my earlier analysis and posts the wave analysis in this post (combining Gann and Elliott wave theories), the Fibonacci targets, the planetary Venus Mars cycle and the North Node entering Taurus in January 2022 all suggests we are possibly heading to a crest in the stock market anywhere between November 2021 - January 2022. Crests will take some time to form, so be careful.
As we are dealing with probabilities of cycles coming together, do not trade the projections or forecasts but wait for the actual confirmation in the chart in front of you.
Disclosure: No positions at the time of writing. Read our full disclaimer.
Stay tuned for my next newsletter. Subscribe and it will arrive in your email box when published.
PS: I am preparing a special publication: The Fiorente2 - Yearly Stock Market Outlook 2022. Stay tuned for further notices and let me know if you are interested in reply to this post or email and what you like to be included in this 2022 Stock Market Outlook.
I have decided that the first 333 subscribers to this exclusive publication will get a 66.66% discount on the regular price. The next 333 subscribers will get a 33.33% discount, and you can guess all of the next 333 subscribers and beyond will pay the regular price ($99). Stay tuned and let me know if you are interested in reply to this post or email.
Brillant!
Excellent! TYSM 🕉